Upskilling Academy
Trusted by 3 million learners 24/7 online training Money back guarantee Fully accredited courses
Level 3 Certificate in Data Visualisation for Accountants Thumbnail Lifetime Access
Sale

Level 3 Certificate in Data Visualisation for Accountants

Data Visualisation for Accountants Overview In today’s fast-paced and data-driven business environment, the ability to communicate financial insights…

Best Seller Limited Time Offer
Last Updated 19 Oct 2026 352 Enrolled English Flexible Schedule

Access to 1500+ Courses with free CPD Certificates for Only £59 Get Now

What you will learn

  • - Gain practical skills to transform complex financial data into clear, compelling visuals
  • - Improve decision-making by creating charts and dashboards that highlight key business insights
  • - Save time and reduce errors with automated reporting and dynamic data presentation techniques
  • - Enhance client and stakeholder communications with professional, easy-to-understand graphics
  • - Stay ahead in your accounting career by mastering industry-standard visualisation tools
  • - Learn to spot trends, anomalies, and opportunities at a glance
  • - Increase your confidence presenting financial information to both technical and non-technical audiences

Description

Data Visualisation for Accountants

Overview

In today’s fast-paced and data-driven business environment, the ability to communicate financial insights effectively is critical for both organizational success and personal career growth. Data Visualisation for Accountants is a comprehensive and practical course tailored specifically to accounting professionals who wish to harness the power of visual storytelling with data. This course goes far beyond simple bar graphs and pie charts, guiding students through the principles, tools, and best practices of turning complex accounting data into impactful visuals that inform decision-making, enhance reporting, and drive actionable insights across all levels of an organization.

Description

The role of the accountant has evolved dramatically. Modern accountants are no longer just stewards of numbers—they are strategic advisors who must interpret, present, and communicate financial data to a variety of stakeholders. However, raw data and dense spreadsheets can only do so much. This course fills a critical skills gap by teaching students how to transform complicated financial information into compelling, clear visual narratives that can reveal trends, pinpoint anomalies, and inspire confidence.

Over the course of this program, you will:

  • Understand the foundational principles of data visualisation and why they matter in the context of accounting.
  • Examine the variety of visualisation types (e.g., line versus bar charts, scatterplots, heat maps, dashboards) and learn which to use to highlight specific financial relationships and findings.
  • Explore the psychology of visual perception and how to design charts that minimize cognitive load and maximize comprehension.
  • Gain hands-on experience with popular data visualisation tools and software, such as Microsoft Excel, Power BI, Tableau, and Google Data Studio.
  • Learn how to extract and clean accounting data from multiple sources, including ERP systems, CSV files, and databases, preparing it for effective visualisation.
  • Apply visualisation techniques for key accounting concepts: cash flow trends, variance analysis, budget vs. actuals, financial ratios, risk analysis, and fraud detection.
  • Develop interactive dashboards and automated reporting solutions that streamline the reporting process and enable on-the-fly data exploration.
  • Understand compliance and ethical considerations related to presenting financial data to internal and external audiences.

Every module is underpinned by real-world accounting case studies, hands-on exercises, and peer-reviewed projects, ensuring you graduate with both the theoretical knowledge and practical skills to immediately enhance your organisation’s data-driven decision-making.

By mastering data visualisation, you’ll not only improve your own analytical skills but also help your team and company see the story behind the numbers—enabling better strategic choices and more meaningful discussions.

Career Path

Strong data visualisation skills for accountants are increasingly in demand across industries and sectors. Upon completion of this course, you’ll open doors to several advanced career tracks, such as:

  • Financial Analyst — Enhance your ability to communicate clear, concise, and visually engaging analyses to executive teams and investors.
  • Management Accountant — Create interactive dashboards for departmental reporting and drive business performance reviews.
  • Audit and Assurance Specialist — Visually pinpoint anomalies and showcase key audit findings in a comprehensive manner.
  • Risk Consultant — Build risk models and demonstrate risk exposure through intuitive visual formats.
  • Business Intelligence (BI) Specialist — Bridge the gap between finance and IT, designing financial dashboards for organizational insights.
  • Finance Manager/Controller — Improve monthly, quarterly, and annual reporting, informing strategic decisions at the highest level.
  • Freelance Consultant — Differentiate your services by offering data visualisation expertise to clients looking to upgrade their reporting workflows.

With these new skills, accountants can position themselves as indispensable contributors to any business, fostering a data-informed culture and supporting data-driven decision making.

Who Is This Course For?

  • Professional accountants, including CPAs, CAs, and CMAs looking to modernize their skill sets and stand out in an increasingly technical field.
  • Finance professionals who want to upgrade their analytical and reporting capabilities.
  • Internal auditors, financial analysts, and risk managers responsible for conveying findings through data presentations.
  • Accountancy students who wish to build their resumes with essential data skills that set them apart during recruitment.
  • Managers who review finance team outputs and want to better understand and implement effective financial visualisations.
  • Anyone involved in preparing or delivering financial data for decision-makers and stakeholders.

No prior programming or advanced statistical background is required—just a willingness to learn and a desire to make data-driven impact in your accounting career.

Requirements

  • A basic understanding of accounting concepts and financial statements (e.g., income statement, balance sheet, cash flow statement).
  • Familiarity with spreadsheet software (such as Microsoft Excel or Google Sheets).
  • Access to a computer or laptop capable of running standard accounting and data visualisation software (specific installation instructions and resources will be provided for optional tools like Power BI and Tableau).
  • Willingness to participate in hands-on exercises, peer-to-peer sharing, and project-based assessments.
  • A drive to improve data literacy and a commitment to ethical data presentation.

All required datasets, project templates, and recommended software will be provided during the course. While the lessons are designed for a global audience, examples are primarily based on International Financial Reporting Standards (IFRS) and generally accepted accounting principles (GAAP).

Join now to unlock the transformative power of data visualisation and propel your accounting career into the future!

Course Curriculum

Course Content

Module 1_ Introduction to Data Visualization for Accountants.

  • Lesson 1_ Introduction to Data Visualization for Accountants.

Module 2_ Data Preparation and Cleaning.

Module 3_ Basic Charts and Graphs.

Module 4_ Advanced Visualization Techniques.

Module 5_ Dashboard Design Principles.

Module 6_ Financial Reporting Visualization.

Module 7_ Budgeting and Forecasting Visualization.

Who should take the course

  • - Accountants looking to improve their data presentation skills
  • - Finance professionals who want to create effective charts and graphs
  • - Audit staff seeking to communicate insights visually
  • - Accounting students interested in data analysis
  • - Managers and team leads in accounting departments
  • - Bookkeepers aiming to present financial information clearly
  • - Small business owners managing their own accounts

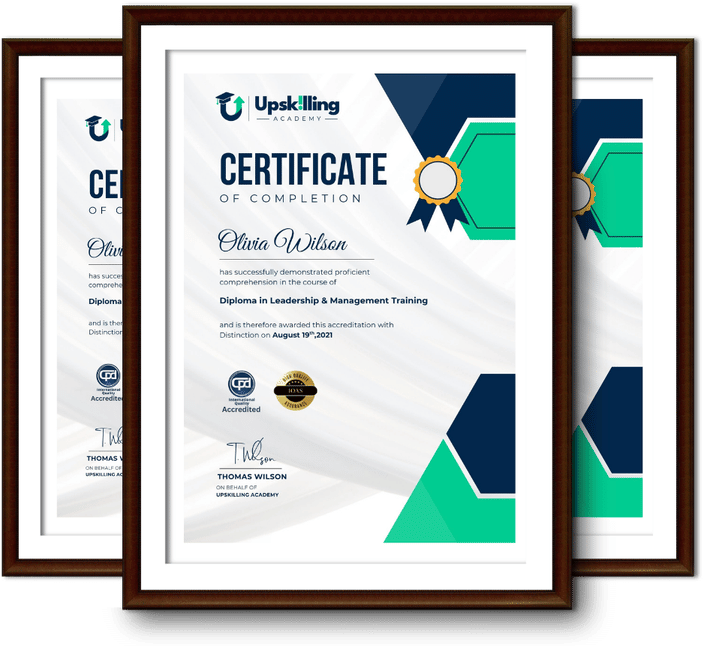
Certificate for Success at Every Step

  • No expiry date. You can keep and use the certificate forever.
  • Recognised across various UK industries.
  • Increases your chances of employability.
  • Boosts your professional credibility.
  • Shows you're up to date with industry knowledge.
Framed Upskilling Academy certificates of completion

Course Reviews

Christine Ferguson

My experience with you was fantastic and easy to navigate. I'm looking forward to taking the course.

Jesse Harding

Provided highly informative and helpful responses, with quick and efficient replies.

Gary Schwartz

The course selection is broad, engaging, easy to follow, and offers a good challenge.

Bailey Burrows

Excellent course with user-friendly website navigation, making it easy to follow. I'm really enjoying the experience.

Benjamin Moreno

Great course with valuable information. Easy to follow, and I appreciated the flexibility to work at my own pace.

Quality Accreditation

  • incensu Registered Education Supplier
  • Association of Healthcare Trainers member
  • The CPD Group approved provider #790985
  • Disability Confident Committed

FAQ for Level 3 Certificate in Data Visualisation for Accountants

How do I access my course?

Once you complete your purchase, you’ll receive access to your course through your Upskilling Academy account. You can log in and access your learning materials online at any time.

How long do I have access to the course?

Your access period depends on the course and the package you purchase. Please check the course details or your order information for the applicable access period.

Can I study at my own pace?

Yes. Upskilling Academy courses are designed to provide flexible online learning, allowing you to study at a pace that suits your schedule.

Will I receive a certificate?

Certificate availability varies by course. Where a certificate is included, you’ll receive information about the requirements and how to obtain it within the course or upon completion.

Are the courses suitable for beginners?

Many courses are suitable for beginners, while others may assume some previous knowledge. Please review the individual course description for information about the recommended level and prerequisites.